The objective of this article is create a SSRS report with geospatial data. Here we will use geospatial data for representing the location in map and analitical data for business information with respect to that location. We are going to create a simple Bubble map which will show Sales for States.
1) Start the Map wizard in Report Builder or Visual studio
2) Choose Map gallary for Geospatial data and select USA BY states
3) Choose Bubble map to show state wise sales Information
4) Choose the analytical dataset which contains sales information
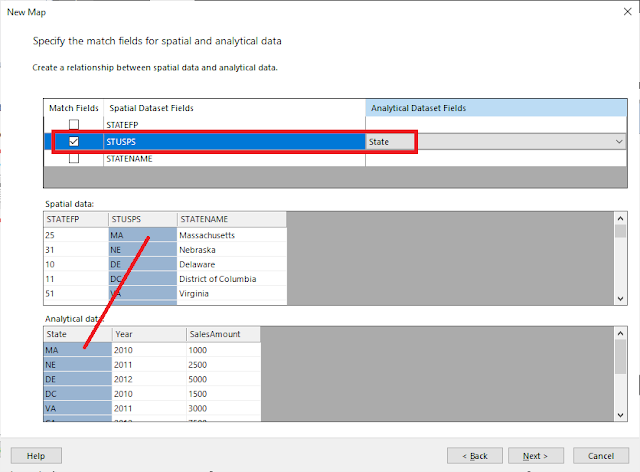
5) Map the fields between spatial dataset and analitical dataset so that both the dataset can be joined. For this example state & STUPS is the key column to join both the dataset.
6) Select the field to visualize the bubble sixe and Label, in this example, we have selected Sales Amount for both Bubble size as well as Label.
7) Now run the report.


No comments:
Post a Comment