Tuesday, December 21, 2021

Recommendation for SQL Query if date column data type is NVARCHAR (String)

Problem: If date column in SQL Server table is of NVARCHAR (String) type.

1) Because of nvarchar datatype, date in the column looks like ‘0000-00-00’ or some other date related string.

2) As it is NVARCHAR datatype, we need to use string functions like LEFT,RIGHT or replace to get required value like year / month which will degrade the performance of the query

3) Sorting of data will take more time if date values are as NVARCHAR compare to datetime which reduce the performance the query.

Recommendation:

1) Data type for [date] should be to change to DATETIME

2) If any future dates available that can be converted to ‘1900-01-01’

3) ETL/ETL script should convert any invalid dates to ‘1900-01-01’

4) In this way, we can improve the performance of the query

Tuesday, August 10, 2021

Power BI: How to create Age slicer if date of birth is the only field available in the data model

If there is a requirement of creating an Age slicer which is numeric slicer and only date of birth is available in data model then we can achieve by getting fractional year value between date of Birth & Current date using YEARFRAC DAX function.

YEARFRAC function: Calculates the fraction of the year represented by the number of whole days between two dates.

YEARFRAC(<start_date>, <end_date>, <basis>)  

Note: <basis> is optional

Create a new column named "Age" with below formula

Table Name – Employee
Column Name – DateofBirth 

Age = INT(YEARFRAC(Employee[DateofBirth]),TODAY(),1))

Create a new slicer for "Age" with newly created column "Age".


Monday, July 19, 2021

Power BI - How to create 5 STAR Rating in Power BI


1)   What is 5 STAR Rating

Customer review(s) help us in building our brand and also helps customer to choose which service/brand they should use. Five STAR Rating (★★★★★) is very simple & easy way to understand quality of service or brand value. It plays a very vital role in business.


2)   REPT & UNICHAR DAX function(s) in Power BI

We are going to use UNICHAR & REPT functions to implement Five STAR Rating:

a.      UNICHAR

                                                  i.      UNICHAR function returns the Unicode character referenced by the numeric value.

                                                ii.      Syntax – UNICHAR(number)

                                              iii.      The character represented by the Unicode number 9733 is ( character).

                                               iv.      The character represented by the Unicode number 9734 is (character).

                                                 v.      UNICHAR(9733) returns

                                               vi.      UNICHAR(9734) returns

b.      REPT

                                                  i.      REPT function repeats text a given number of times

                                                 ii.      Syntax - REPT(<text>, <num_times>)

                                               iii.       REPT("A",3)  returns AAA


 3)   How it works in Power BI

a.      Open the Power BI Designer

b.      Create a table e.g StarRating with values 1-5 in column named Rate.


c.       Create a calculated Measure using UNICHAR & REPT to generate the 5 STAR Rating (★★★★★)

d.      Expression:
REPT(UNICHAR(9733), AVERAGE('StarRating'[Rank]))  &&

REPT(UNICHAR(9734), 5 - AVERAGE('StarRating'[Rank]))


4)   Understanding of DAX Expression(s) & 5 STAR Rating


5)   Conclusion: We are able to generate 5 START Rating in Power BI

Thursday, July 15, 2021

Power BI - How to refresh single table from data model

Issue: When we click on Refresh button to refresh the table(s) in Power BI Designer, by default, it will start refreshing all the tables in the data model. Sometimes, we may need to refresh only 1 or 2 tables instead of complete Data Model.  Refreshing complete data model is a time consuming process depends on volume of data & unnecessary utilization of CPU, I/O & memory if complete data model refresh is not required. To avoid such refresh issue, Power BI provides a way of refreshing table individually.


Steps to refresh table individually:

      1) Open the Power BI Designer

      2) Right click on the table which need to refresh. Click on Refresh.


          3) It will start refreshing the table


Friday, June 25, 2021

Power BI – How to convert PBIX file to PBIT file

Overview:
PBIX – PBIX is the file format or file structure of Power BI report. It consists of the following:

      1)    Report Layout/Visualization definition

      2)    Data Model

      3)    Dataset/Queries

      4)    Imported data


PBIT – PBIT is the template file of Power BI report. It consists of the following:

     1)    Report Layout/Visualization definition

     2)    Data Model

     3)    Dataset/Queries

PBIT does not contain the data. During deployment from one environment to another. We provide PBIT file only as part of deployment. We can convert the PBIX file to PBIT.

Following are the steps to convert the PBIX file to PBIT

     ·        Open the Power BI Report

     ·        Click on Fileรจ Save as

     ·        Select “Save as file” as Power BI Template files (.pbit)

     ·        It will save the file in PBIT format


Power BI – How to add search text box in the slicer

Overview:
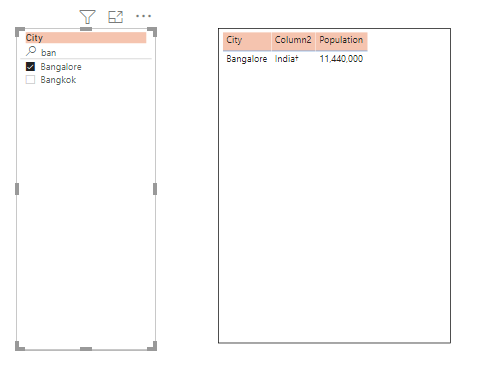
Adding search box in the slicer is very useful in case when we have a very long list of items in the slicer. If we have larger number of items in the slicers then user has to do up / down scroll to find the right value to view the report which is time consuming process. We can add search box in the slicer to find the right value for slicer.


Steps to add search box in the slicer:

      1)    Go to the slicer

      2)    Click on … More options รจ Searchรจ It will add a search box in the slicer


3)    Now search and select the value


-------------------------------End of Article-------------------------------


Thursday, June 24, 2021

Power BI – How to see tabular data from a chart report

1)      Open the chart report in Power BI app or Power Designer

2)      Click on … More options รจ show as a table


Monday, June 14, 2021

Power BI - How to pull the data from Web

1)     Objective

The objective of this article is to provide an easiest way of pulling the data from web that can be utilize as data source for reporting. In this article, we will show you how to pull the data from https://www.espncricinfo.com/ for Cricketing stats e.g. Most double hundreds in a career in test cricket.

 2)     Pre-requisites

a.  Power BI Designer should be installed in your machine

b.  Website where you have access or any publicly access website

c. For this article, we are taking espncricinfo stat page for most double hundreds in a career in test cricket.

https://stats.espncricinfo.com/ci/content/records/230344.html


 3)     Steps to pull the data from web

a.  Open the Power BI Designer

b.  Click on Get dataรจ Web 


c.  It will ask for the URL from where we need to pull the data


d.  It will establish the connection with web page      


e.  Then Navigator window will ask for which information need to pull from web page. In this example, choose Most double hundreds in a career in test cricket. You can also see the data preview. Click on Transform


f.  Here you can see first row is showing column Name. Rename the Column manually with first row of column.


g.  Now we will remove the first row. To remove the first row, click on Remove Rowรจ Remove First Row. It will remove first row. Click on Apply & Close


h.  It will load the data into Power BI Model.


i.   Now you can see newly created table in Power BI Model.


j.   We can utilize this table for Report development.

4)     Conclusion

By using above steps, we are able to pull the data from publicly access website (www).

Sunday, June 13, 2021

rsReportServerDatabaseError - Timeout or low disk condition within the database

Error: An error occurred within the report server database. This may be due to a connection failure, timeout or low disk condition within the database. (rsReportServerDatabaseError)"

While configuring Report Snapshot / Caching, we face above mentioned issue because of Role/Permission issue in SSRS. Reporting Services uses a predefined database role called RSExecRole to grant report server permissions to the report server database.

RSExecRole should exists in Master, MSDB, ReportServer & ReportServerTempDB. Try the below code, it may solve your issue.

USE master
GO
GRANT EXECUTE ON master.dbo.xp_sqlagent_notify TO RSExecRole
GO
GRANT EXECUTE ON master.dbo.xp_sqlagent_enum_jobs TO RSExecRole
GO
GRANT EXECUTE ON master.dbo.xp_sqlagent_is_starting TO RSExecRole
GO

USE msdb
GO
GRANT EXECUTE ON msdb.dbo.sp_help_category TO RSExecRole
GO
GRANT EXECUTE ON msdb.dbo.sp_add_category TO RSExecRole
GO
GRANT EXECUTE ON msdb.dbo.sp_add_job TO RSExecRole
GO
GRANT EXECUTE ON msdb.dbo.sp_add_jobserver TO RSExecRole
GO
GRANT EXECUTE ON msdb.dbo.sp_add_jobstep TO RSExecRole
GO
GRANT EXECUTE ON msdb.dbo.sp_add_jobschedule TO RSExecRole
GO
GRANT EXECUTE ON msdb.dbo.sp_help_job TO RSExecRole
GO
GRANT EXECUTE ON msdb.dbo.sp_delete_job TO RSExecRole
GO
GRANT EXECUTE ON msdb.dbo.sp_help_jobschedule TO RSExecRole
GO
GRANT EXECUTE ON msdb.dbo.sp_verify_job_identifiers TO RSExecRole
GO
GRANT SELECT ON msdb.dbo.sysjobs TO RSExecRole
GO
GRANT SELECT ON msdb.dbo.syscategories TO RSExecRole
GO